Building Fortuna: Planning for Retirement Without Predicting the Future
A Resilient Approach to Retirement Planning
Most retirement calculators give you a single, confident number. You need ₹8 crores. But reality is never that simple. The path to retirement is long and full of uncertainty. What if the market crashes right after you retire?
You don’t retire into a predictable, average return. You retire into a specific sequence of market years that determine your returns. Imagine retiring in December 2007 with ₹5 crores, perfectly on track. By March 2009, the market had crashed over 50%. To cover living expenses, you’d be forced to sell investments at rock-bottom prices. Just two years in, your portfolio would be permanently crippled, not because the plan was wrong, but because you retired at the wrong time. This is “sequence of returns risk,” and it’s one of the biggest threats to a secure retirement.
I built this retirement planner specifically to address that challenge. Instead of just hoping for the best, it prepares for market volatility by building resilience directly into my financial strategy.
Building a Resilient Withdrawal Strategy
Think about when retirement plans fail. It often happens when you’re forced to sell assets at the bottom of a market crash to pay for living expenses, locking in losses at the worst possible time. A common approach is to keep six months of cash as an emergency fund. That’s a good start, but it may not be enough to weather a prolonged downturn.
A more resilient approach is to structure your portfolio so you can avoid selling growth assets for several years if needed. When markets crash, you can live off your cash reserves and give your investments time to recover. If you’re still in your saving years, a crash even becomes an opportunity to buy more assets at lower prices.
That’s the core idea behind the 4-bucket strategy.
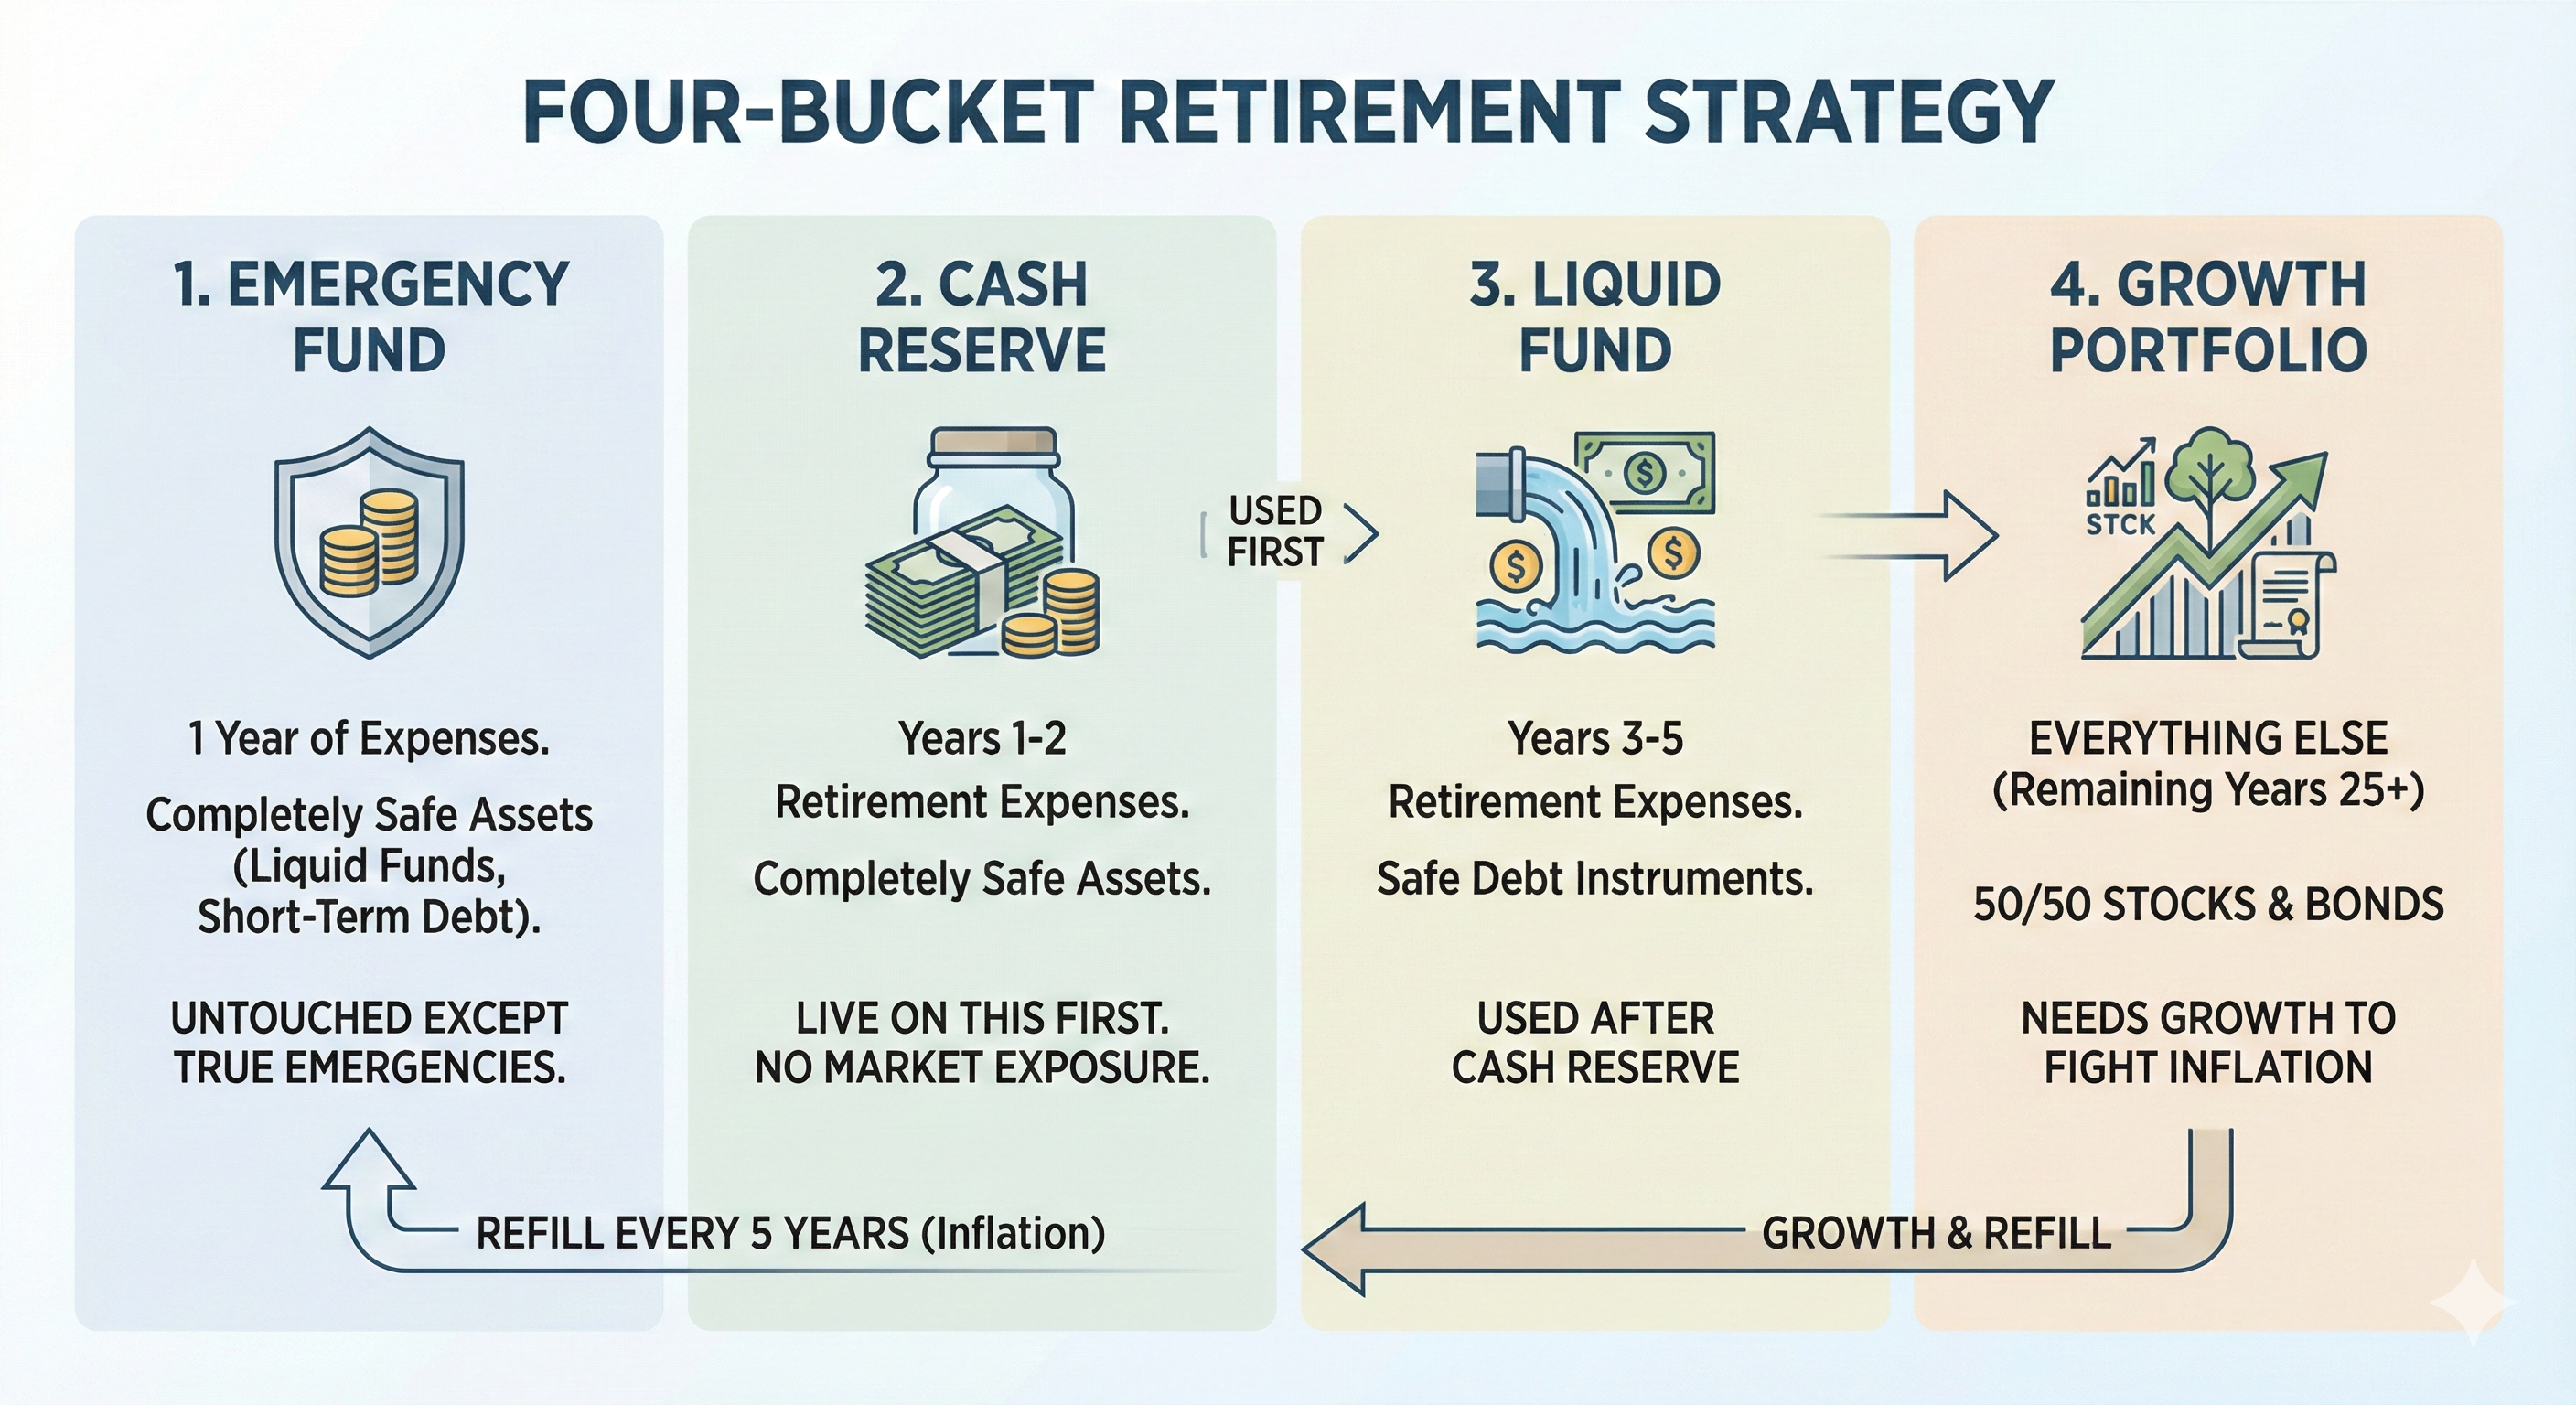
The Four Buckets
The strategy splits retirement money into four pieces, each with a different job and timeline. The first bucket is your emergency fund - one year of expenses kept in completely safe assets like liquid funds or short-term debt. This stays untouched except for true emergencies. It gets refilled every five years from the growth bucket to keep pace with inflation.
The second bucket is your cash reserve, covering the first two years of retirement expenses. Again, completely safe assets. This is what you actually live on when you first retire. No market exposure at all.
The third bucket is the liquid fund, covering years three through five of retirement. Still in safe debt instruments, this kicks in after you’ve exhausted the cash reserve. The fourth bucket is the growth portfolio - everything else, split 50/50 between equity and debt asset classes. This potentially needs to last 25+ years, so it needs growth to fight inflation.
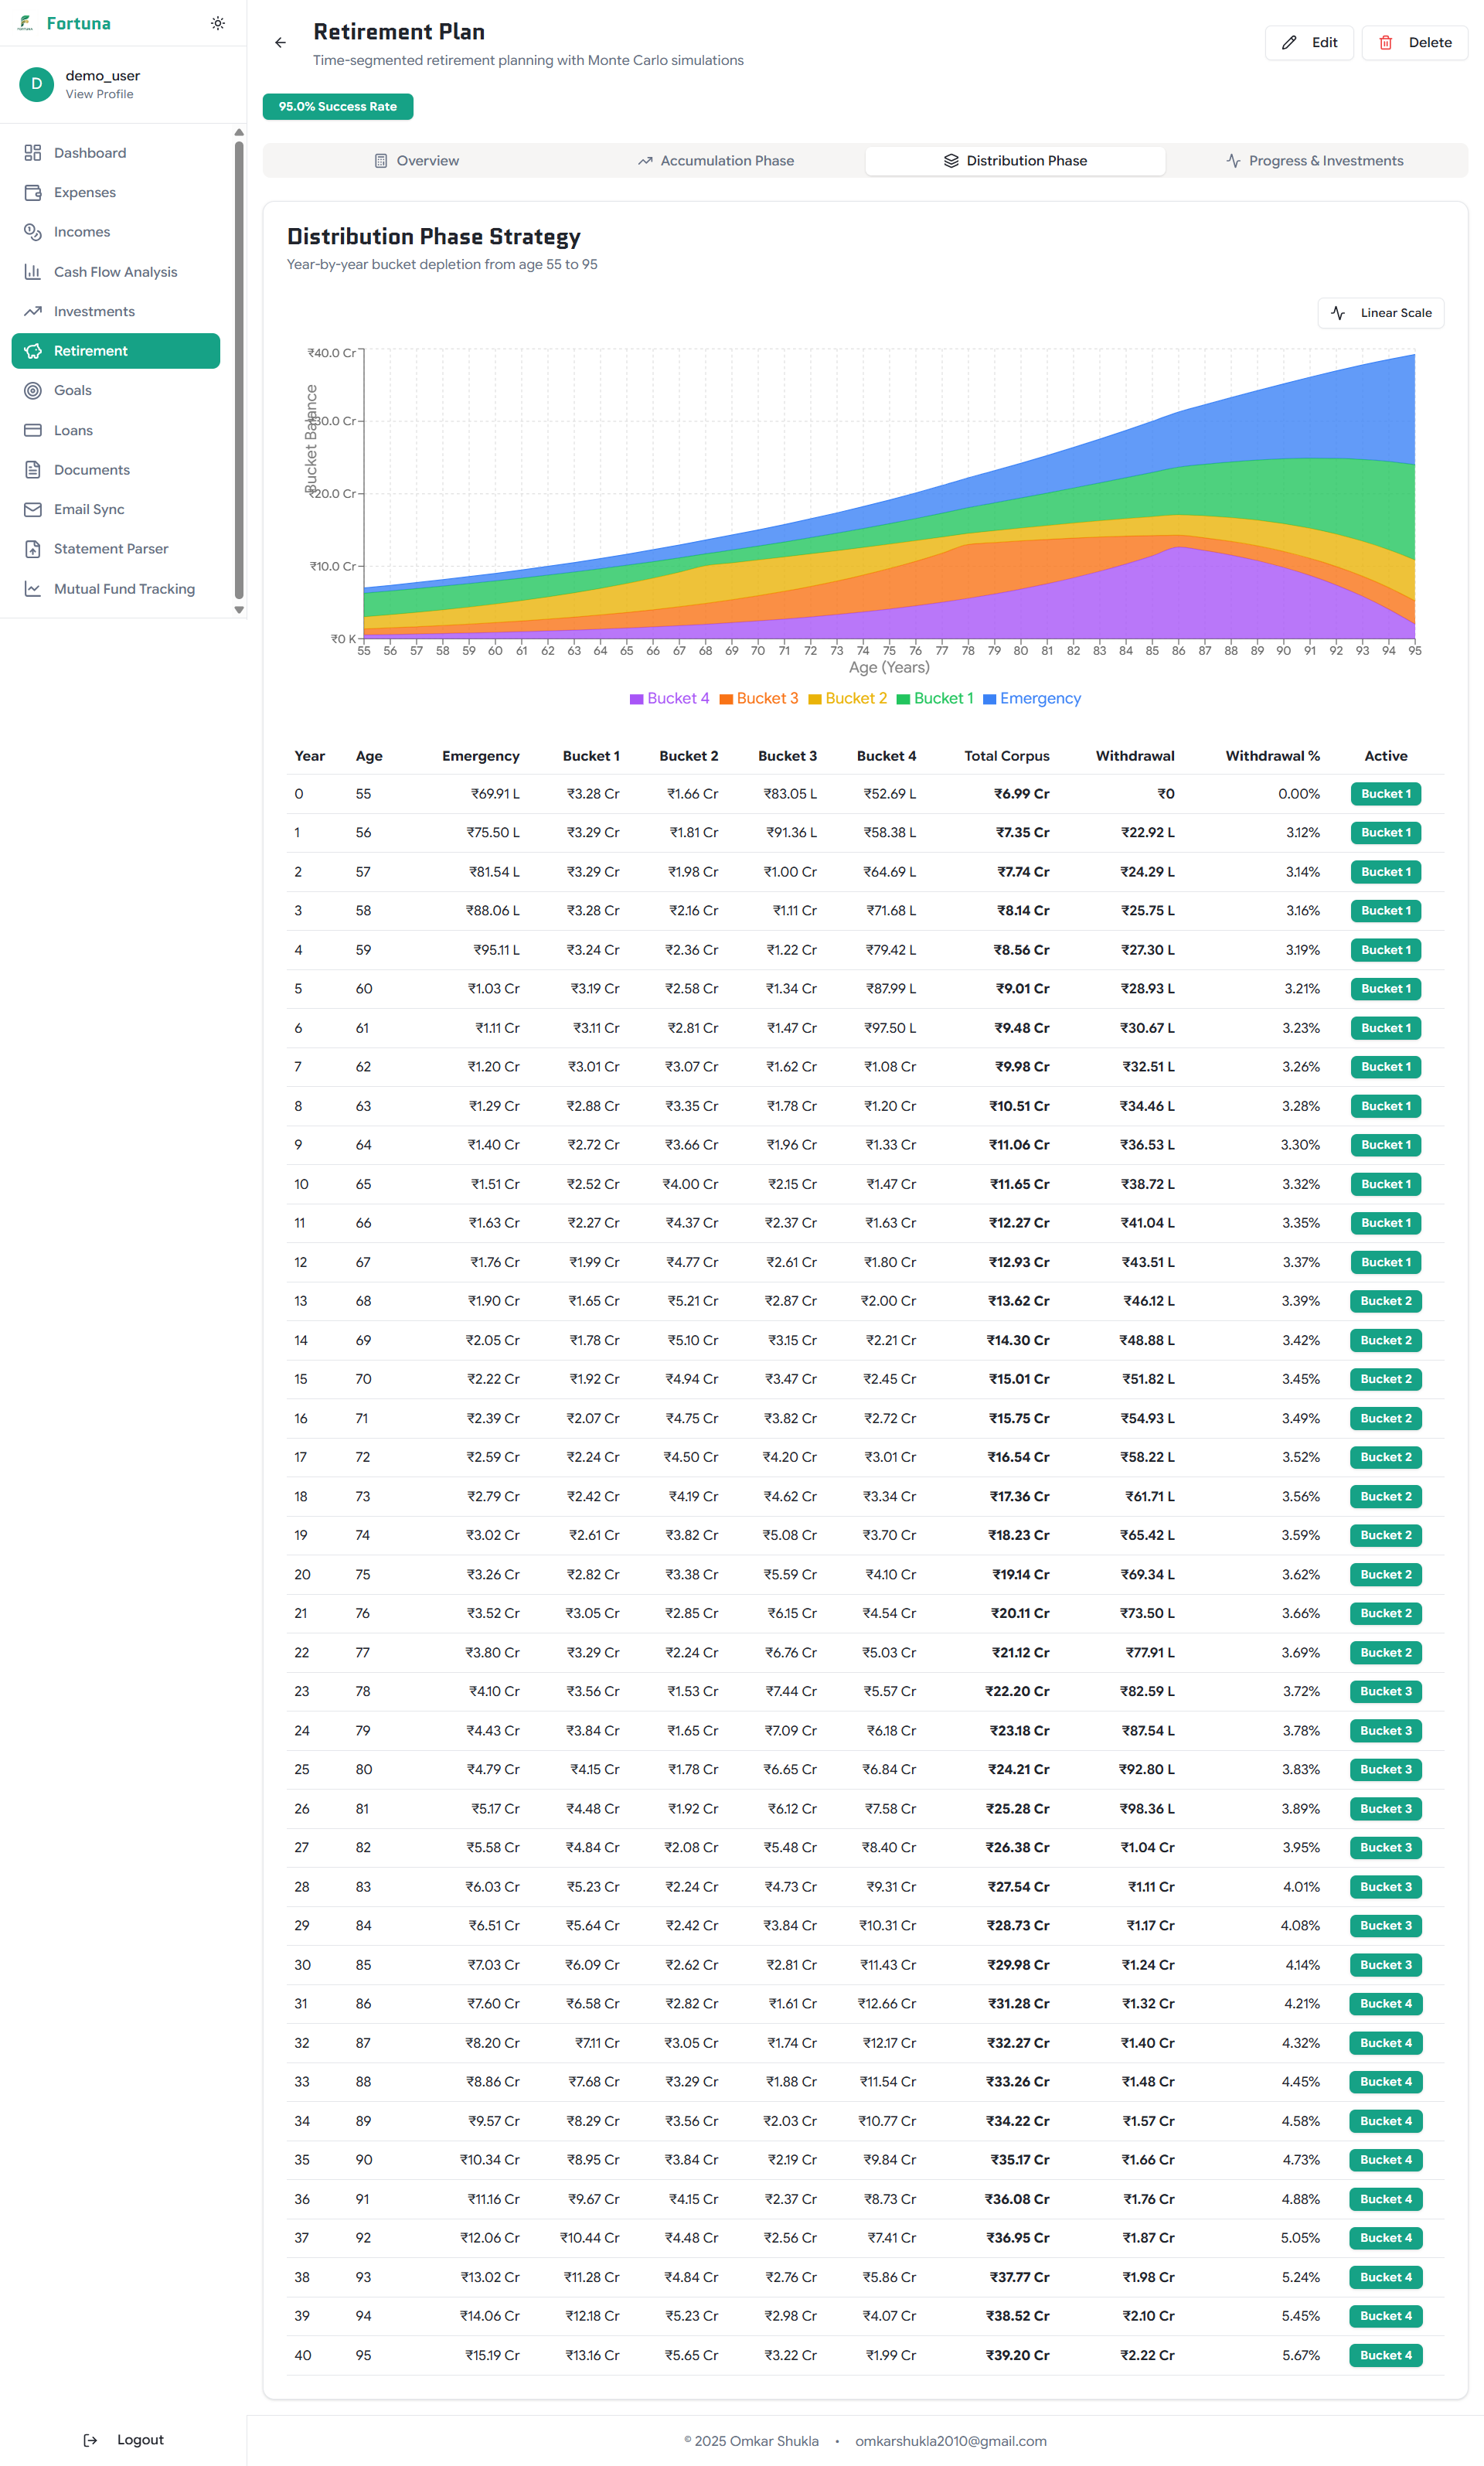
The sequencing matters more than anything else. You don’t touch the growth portfolio for five years after retiring. Market crashes on day one of retirement? Doesn’t matter. You have five years of expenses in liquid assets. You’re not selling anything. While you’re spending from the liquid buckets, the growth bucket continues doing its thing.
The bucket strategy handles withdrawals during retirement. But how do you know if you’re saving enough to fill those buckets in the first place?
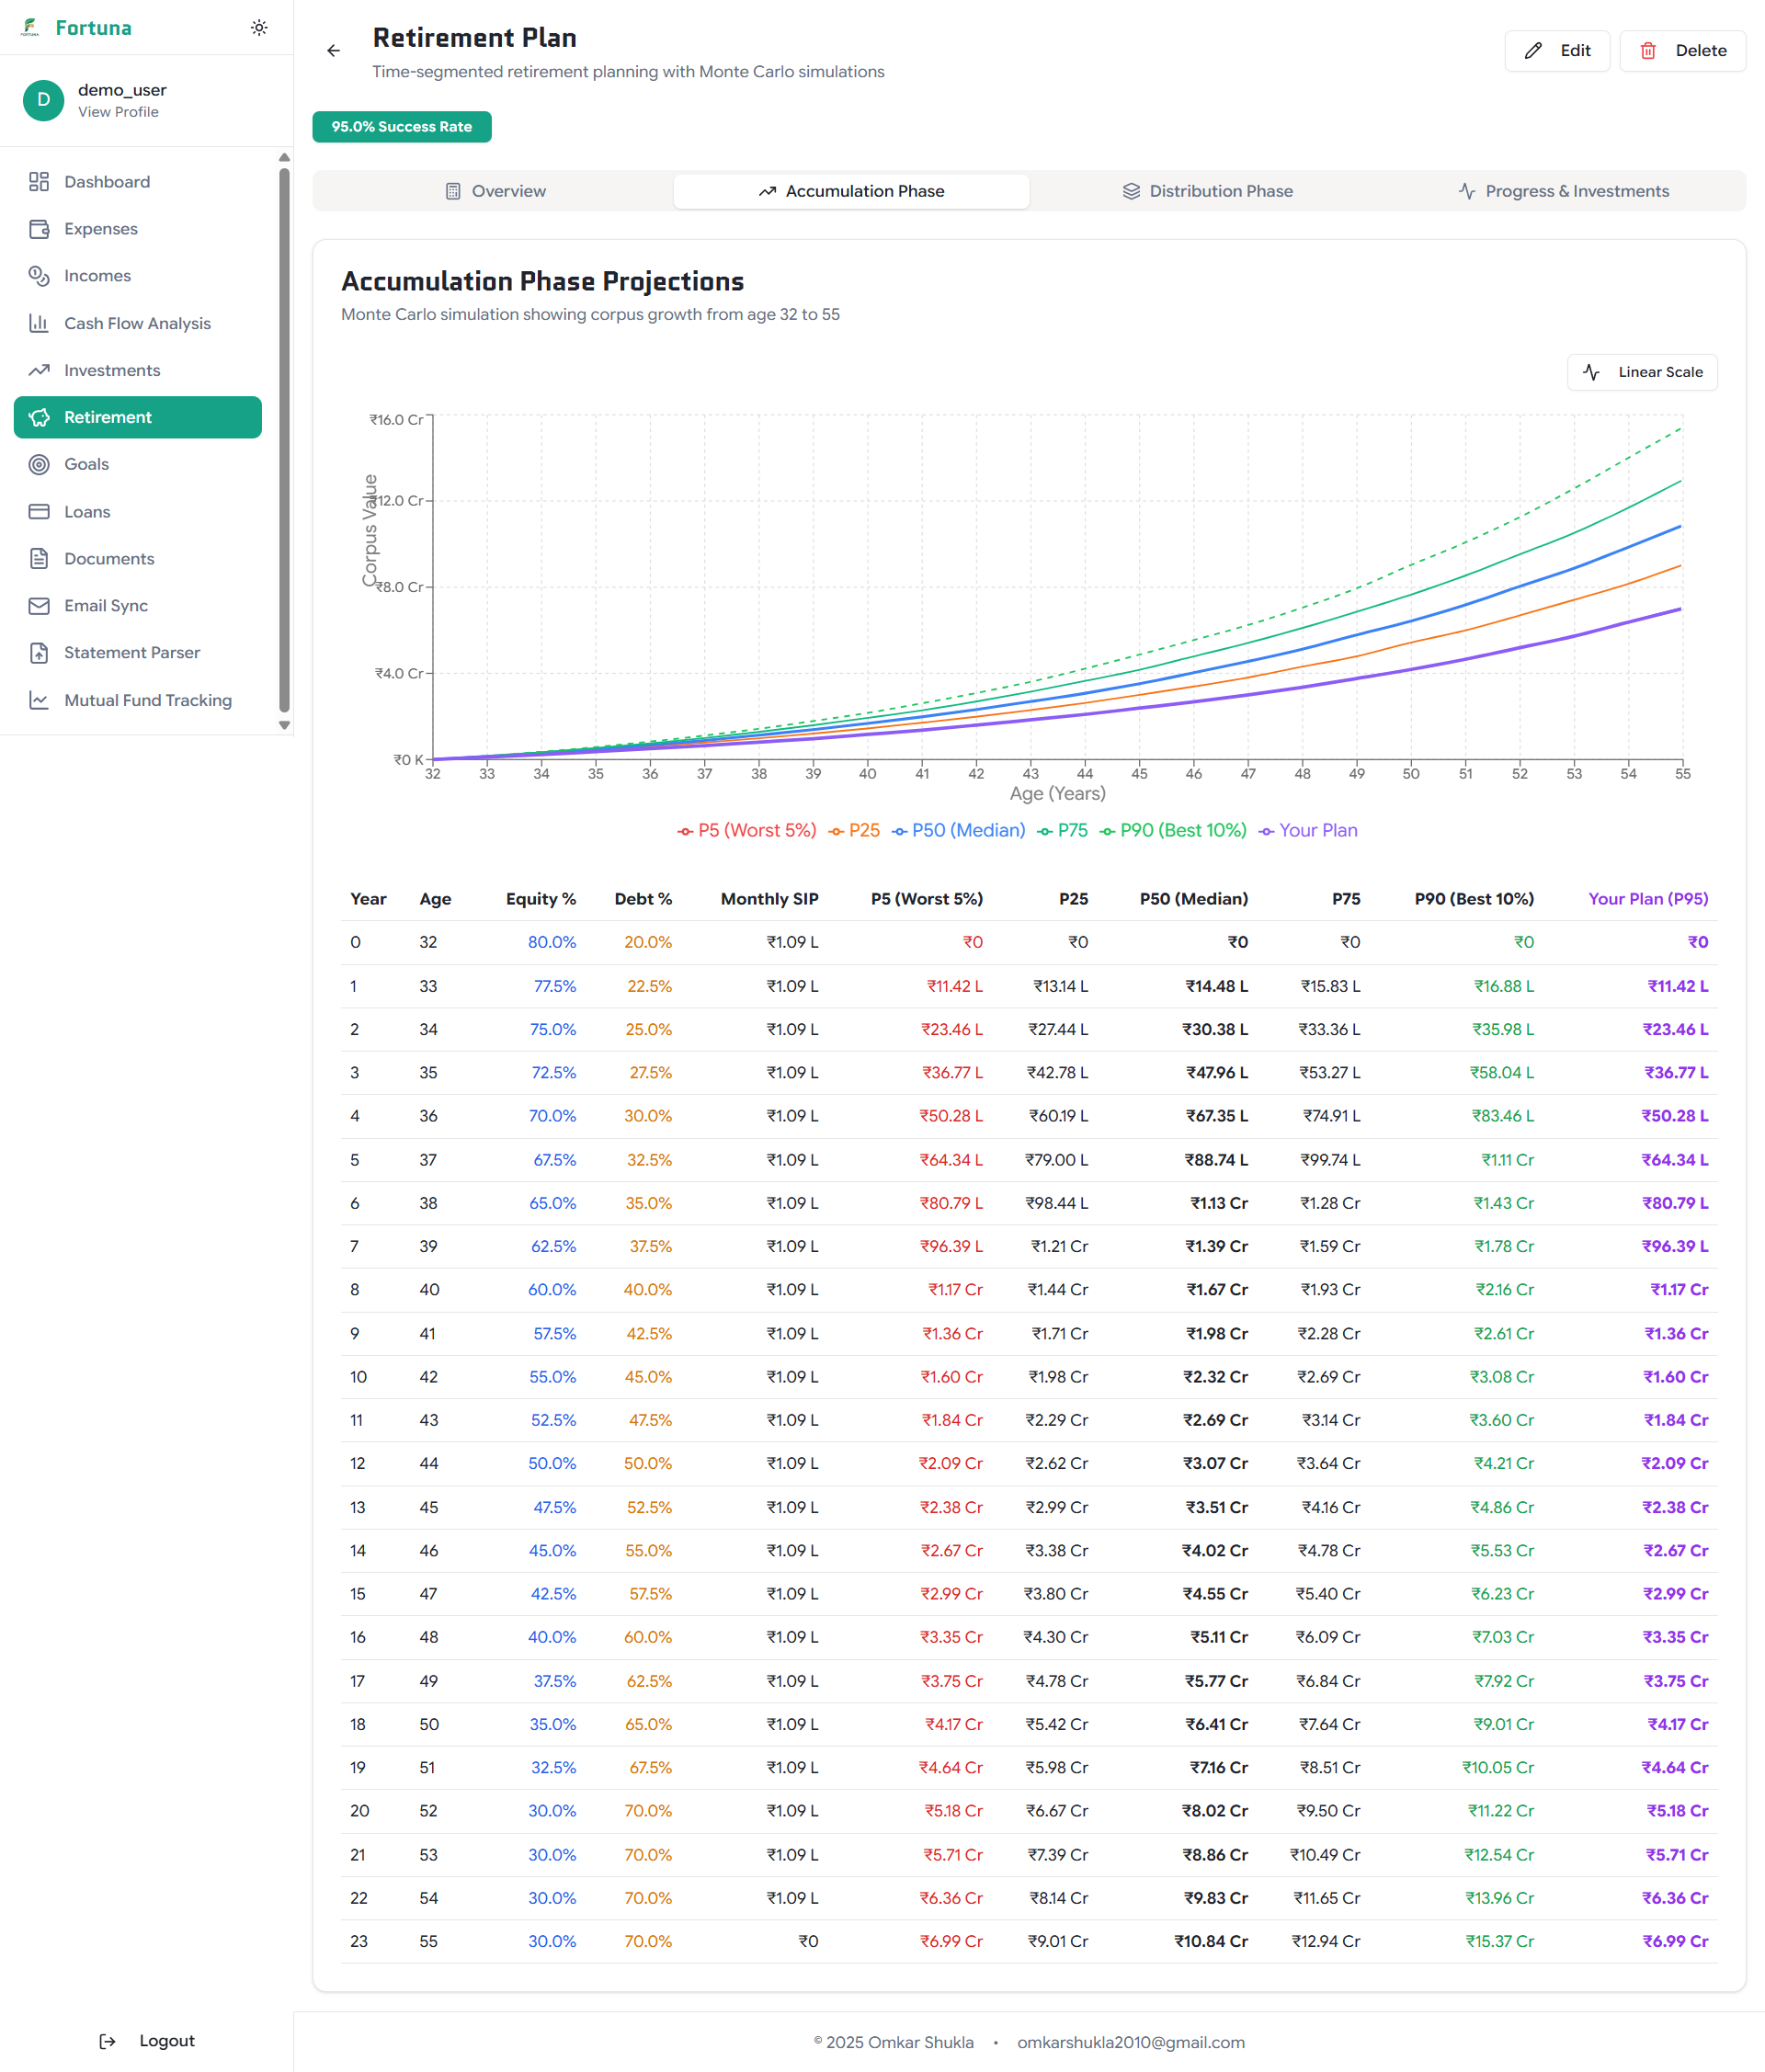
Planning for Reality with Monte Carlo Simulations
Traditional calculators often assume you’ll get a steady, average return, say, 12%, every single year. But reality is never that smooth. You’re more likely to get +30% one year, -20% the next, and then +5%. The order of these returns matters enormously, especially around your retirement date.
So, instead of relying on a single average, this planner runs thousands of different possible futures for your investments. Each simulation uses a different, random sequence of good and bad market years based on historical data. This process lets you see a realistic range of possibilities. What’s a likely worst-case scenario? What’s the best? Where do most paths land?
You then choose a confidence level, for example, 75%. This means your plan is designed to succeed in at least 1,500 out of 2,000 simulations. The other 500 scenarios represent severe, prolonged market crashes where you might need to adjust your spending. The planner then calculates the investment needed to hit that 75% target, giving you a plan that’s built on probabilities, not just wishful thinking.
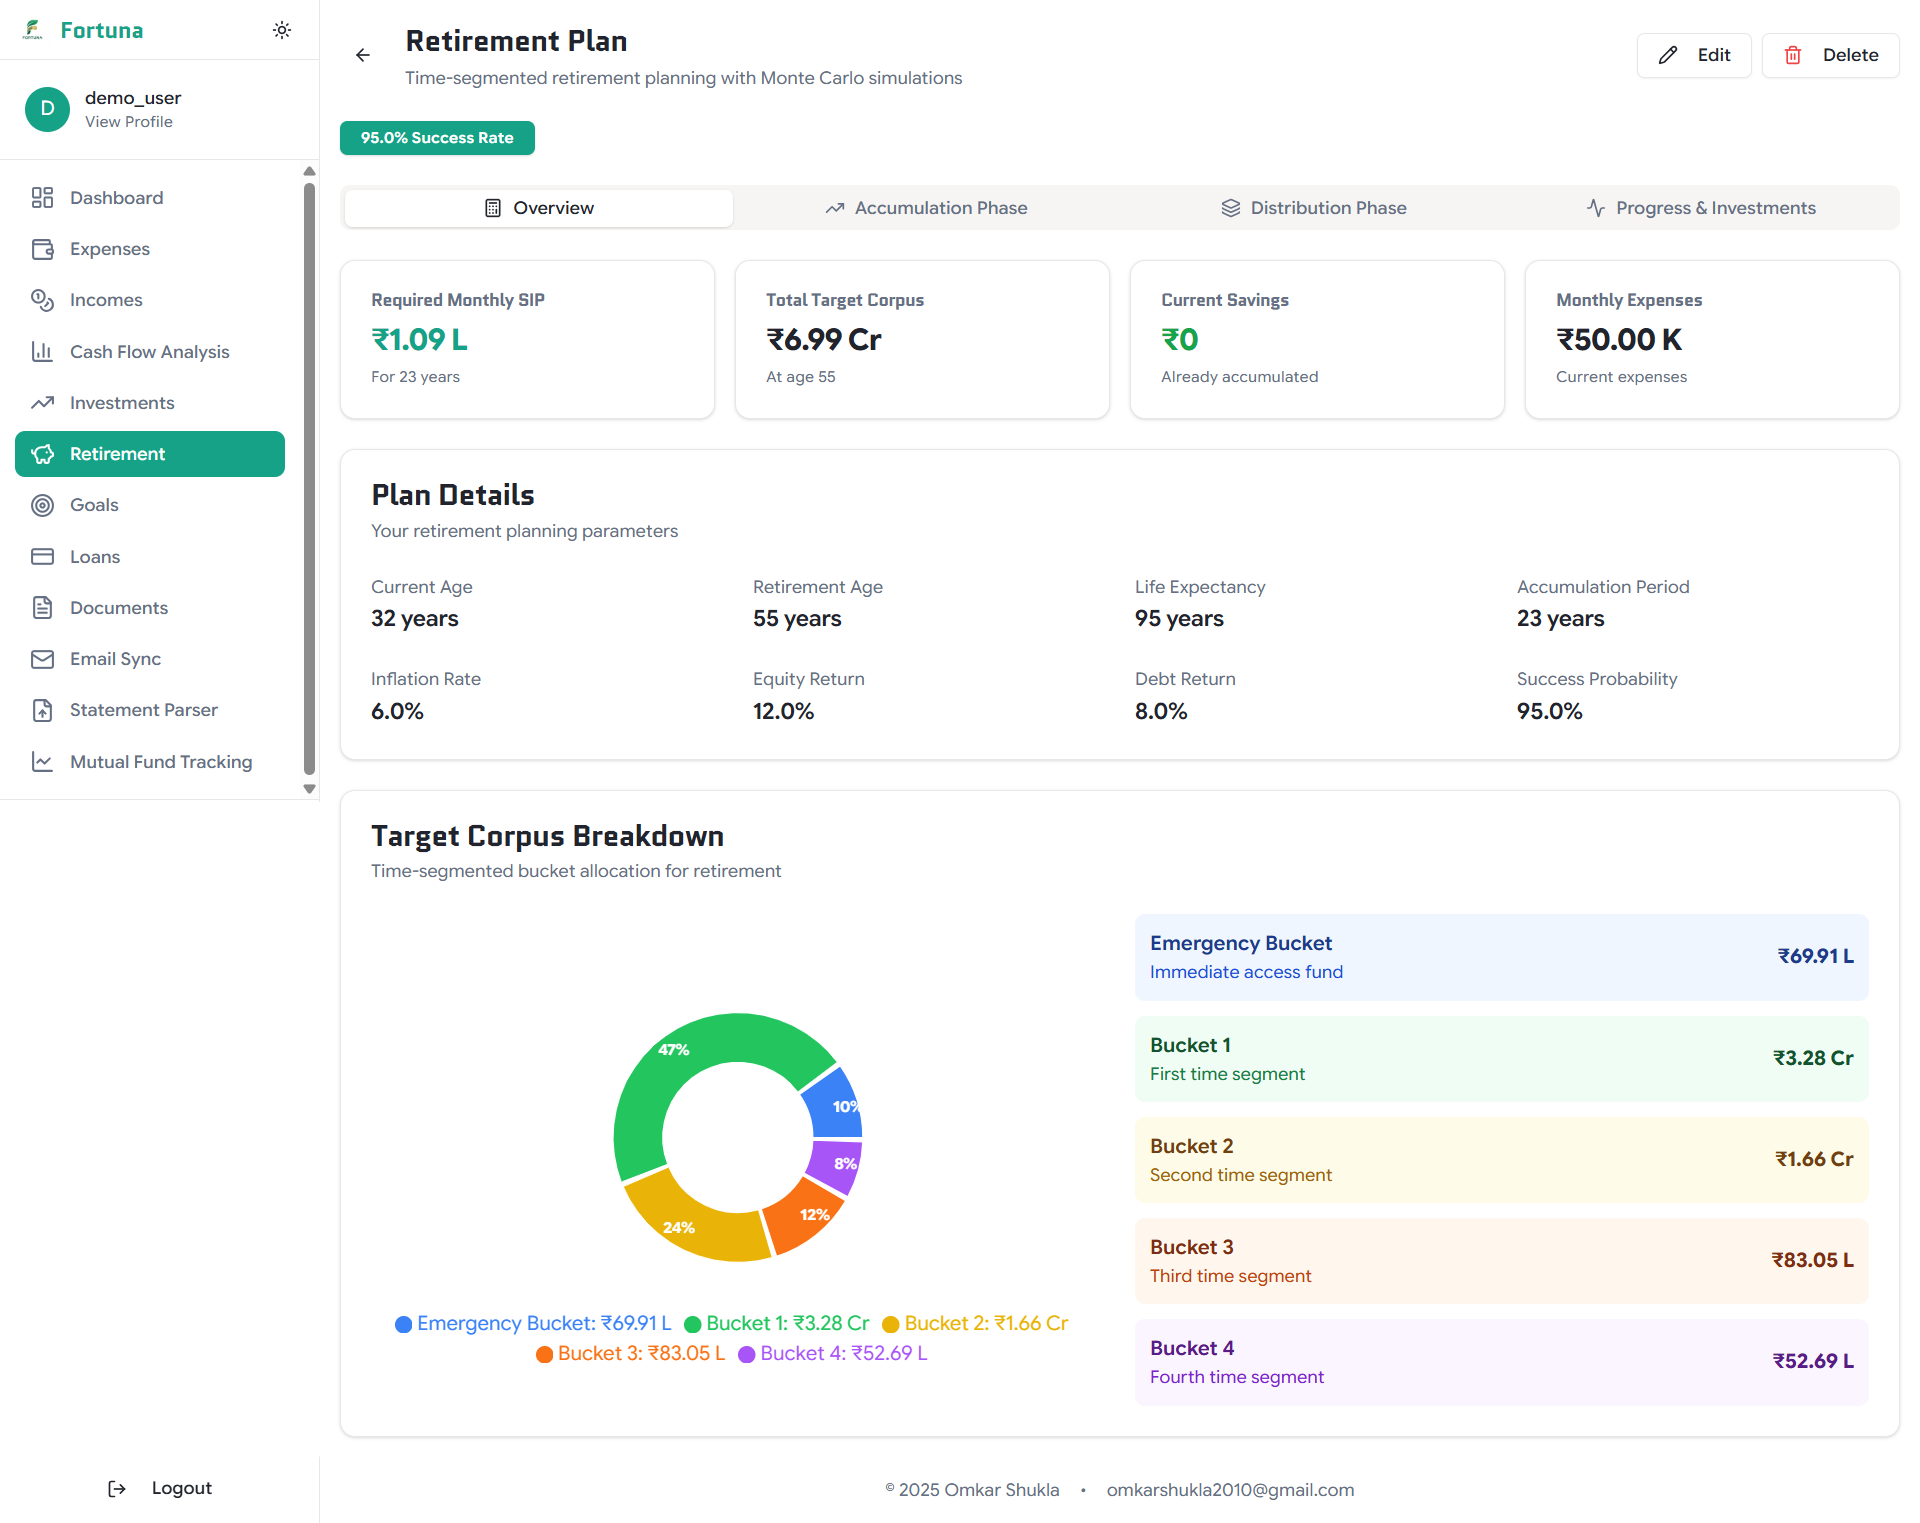
What I Actually Get
When I run the calculator, I get four things. First, the required monthly investment (SIP) to hit my target corpus with my chosen confidence level. Second, the target corpus itself, broken down by bucket so I can see how much goes into emergency fund versus growth portfolio. Third, a year-by-year projection showing my portfolio value, asset allocation, and which bucket I’m drawing from at each age. Fourth, the cone of uncertainty - a visualization showing the range of possible outcomes across all simulations.
Core Principles of This Approach
Three principles guide this approach. First, time segmentation: you’re never forced to sell stocks at the wrong time because the five-year buffer of safe assets gives you time to wait out crashes. Second, optionality: when markets crash during your accumulation years, you have the option to buy more shares at low prices instead of being forced to sell. Third, conservative assumptions: the calculations include a “prudence factor” by slightly reducing expected returns. If markets do better than expected, you have an extra cushion. If they underperform slightly, you’re more likely to still be on track.
The Goal: Resilience Over Optimization
The aim of this planner isn’t to chase maximum possible returns. Trying to perfectly time the market or pick the next big stock is an unreliable strategy. Instead, the focus is on consistency and resilience. The calculator assumes you keep investing regardless of market conditions, which historical data suggests is a sound long-term approach.
It’s important to be clear about this trade-off: resilience isn’t free. Holding several years of expenses in low-yield assets will feel like a “performance drag” during long bull markets. That is the premium you pay for insurance against a crash at the wrong time. The goal is not to have the highest possible portfolio value on paper, but to have a plan that delivers the cash flow you need, when you need it, without fail.
There are no AI predictions or complex, proprietary algorithms. The strategy is built on two established ideas: Monte Carlo simulations to model uncertainty and time-tested bucket strategies for withdrawals. The goal is to build a plan that can survive real-world conditions, not just one that looks good in a spreadsheet.
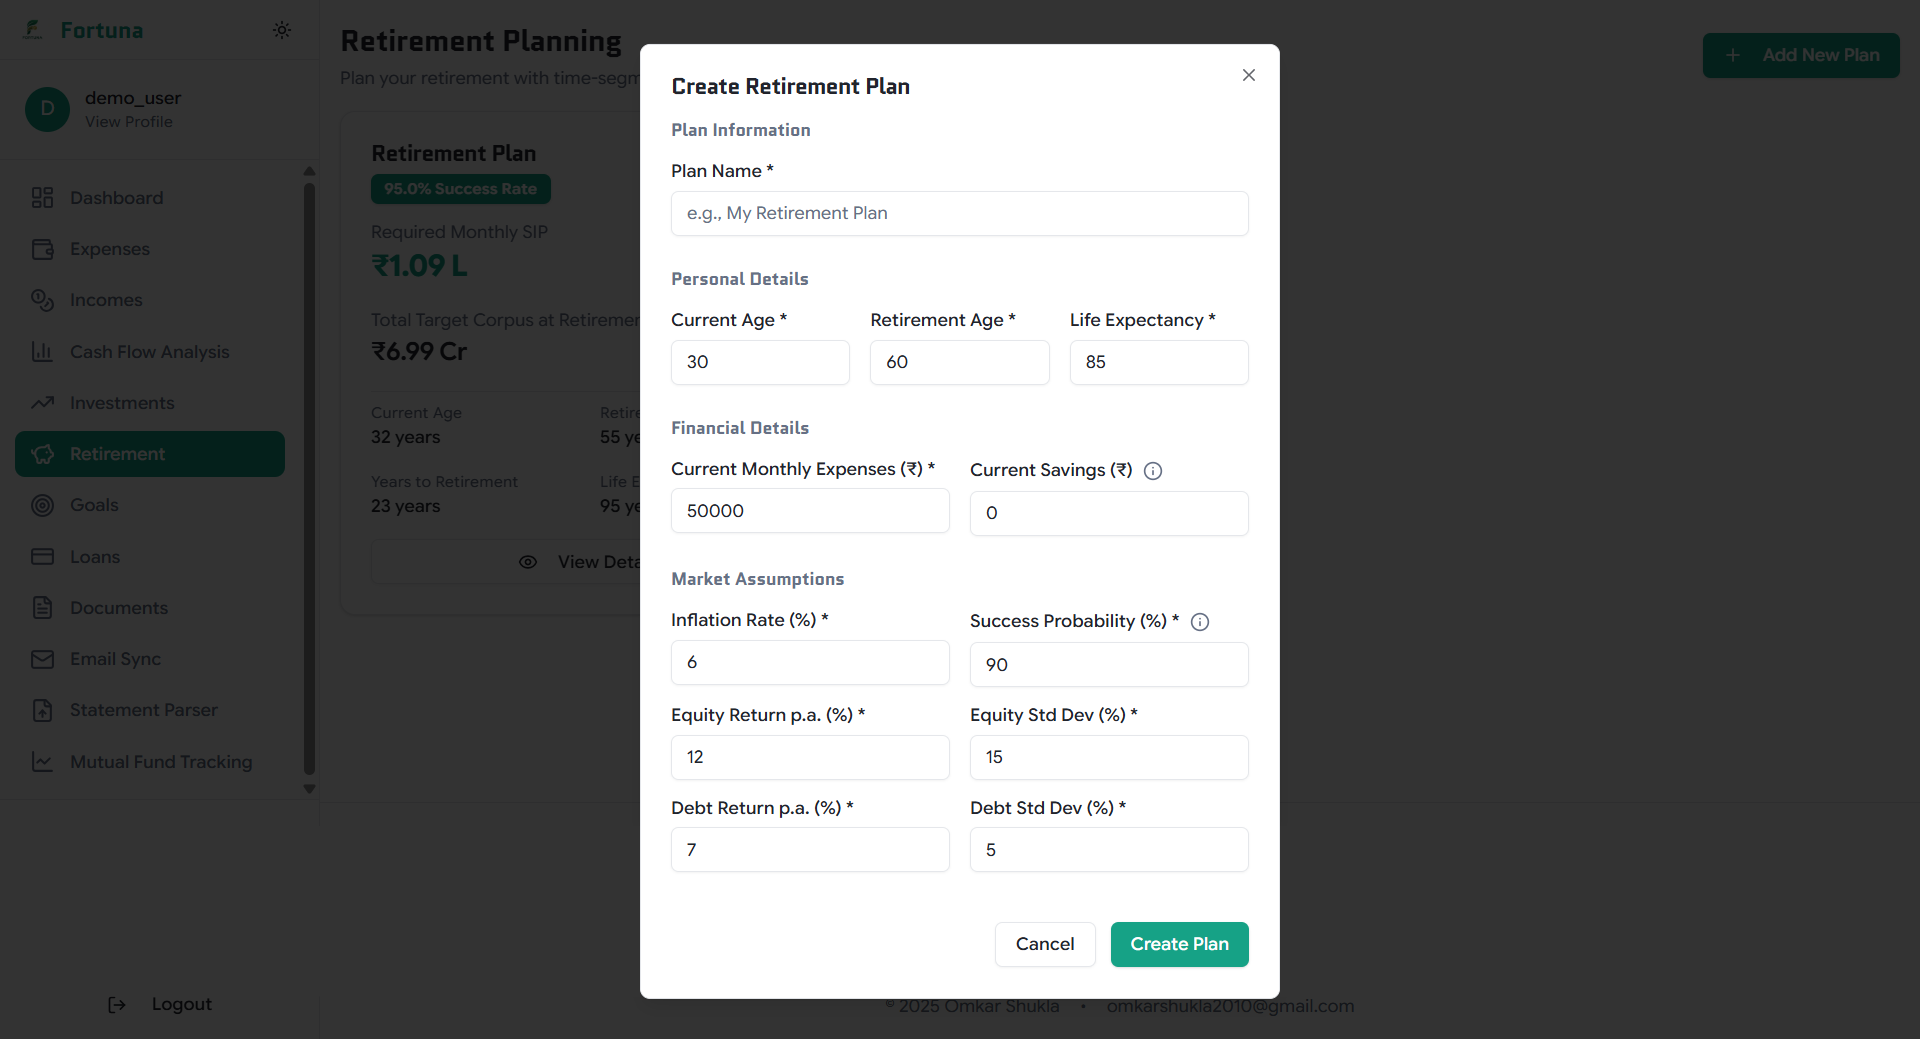
How I Use It
To get started, the calculator only needs a few key details: my current age, when I plan to retire, and my current monthly expenses. It uses sensible, India-specific defaults for technical inputs like inflation and expected market returns, but I have the option to adjust them if I’m more familiar with these concepts. Based on this, the planner shows me the required monthly investment. If that number feels too high, I can instantly see the trade-offs of retiring later, planning for lower expenses, or accepting a lower confidence level in my plan.
Progress Tracking
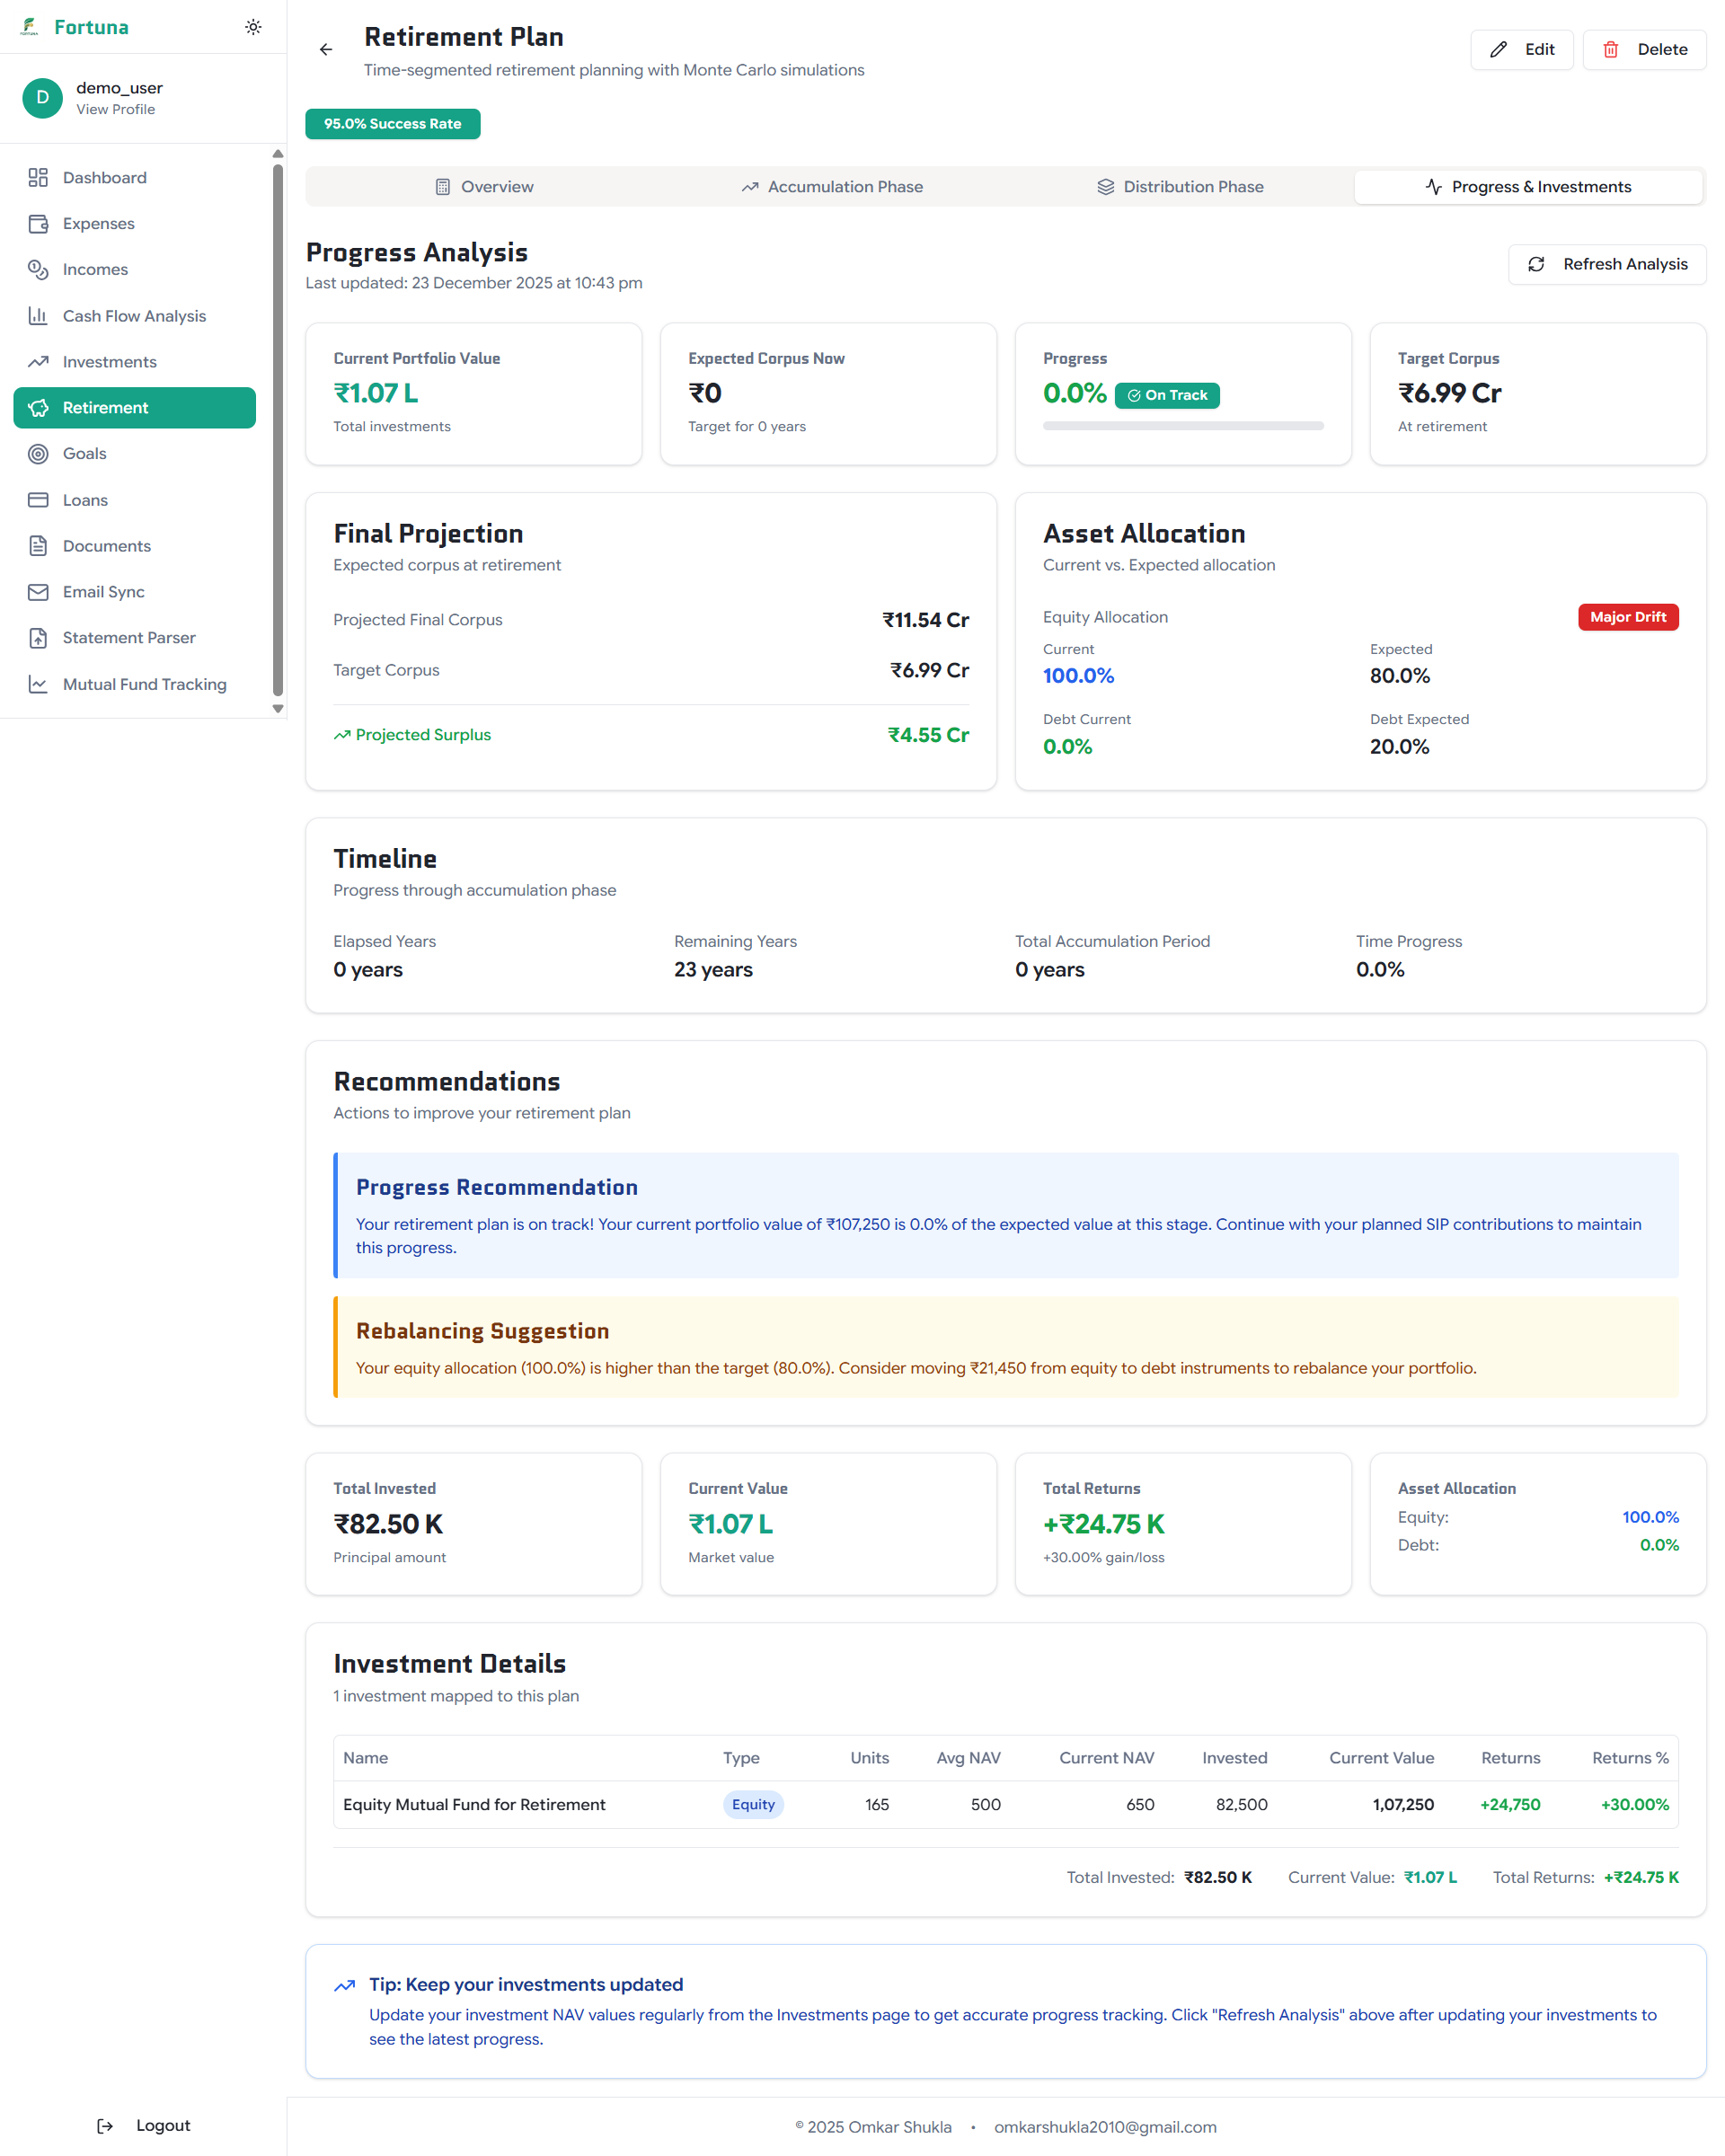
Having a plan is one thing. Staying on track is another. I built progress tracking that shows me where I’m stand versus the target at any point in time. I can see my current portfolio value compared to where I should be. If I’m ahead, I have options - retire earlier, increase my spending, or just enjoy the cushion. If I’m behind, I’ll see exactly how much to increase my SIP to get back on track.
The tracker also shows my asset allocation. If my plan requires a 50/50 split between equity and debt in the growth portfolio, but I’m actually at 70/30, I’ll get a rebalancing recommendation. Small course corrections along the way prevent from waking up at 59 and realizing I’m way off target.
I also get recommendations based on my progress, like “Your retirement corpus is on track” or “Consider rebalancing your growth portfolio.” The system watches the numbers so I don’t have to obsess over them daily.
A Note on Discipline
A financial plan is a framework, but your behavior determines the outcome. This strategy is designed to prevent panic-selling during a crash. However, it also requires discipline during good times. Sticking to your allocation means rebalancing—selling some of your high-flying stocks to refill the cash buckets. It means resisting the temptation to abandon the plan and go “all-in” when the market feels euphoric. The mechanics are sound, but the psychological challenge of execution is just as important.
Why I Built This
I wanted something honest. Something that shows me the range of outcomes, not just the average. Something that builds in safety without being overly conservative or assuming I’ll live like a monk. Something that actually gets stronger when markets crash, rather than just surviving them.
This won’t predict the future. But it might help me prepare for it, whatever it turns out to be.